On July 17, Rice University announced its plan for the fall semester, which included a hybrid mode of instruction where students could attend classes either virtually or in person. The decision wasn’t without controversy; in the weeks that followed, multiple faculty members at Rice wrote of their concerns with the plan to begin classes, eventually culminating in a petition to convene a campus-wide discussion regarding the risks and benefits of opening campus. The petition garnered nearly 100 faculty signatures.
Despite such complaints, Rice opened its doors to in-person students on August 11th. And despite all of the concerns, the university has done a remarkable job at keeping COVID case counts relatively low.
A big part of @RiceUniversity's approach to COVID-19: test often. Within the first two weeks of August, the university recorded over 4000 tests, with a total of 19 positive cases (0.41%). pic.twitter.com/IDI3qtIE6f
— Connor Rothschild (@CL_Rothschild) August 20, 2020
Rice’s success at maintaining low case counts–recording only 37 positive cases across 36,183 tests as of October 10–is not typical of most colleges. At universities across the country, reopening was often accompanied by a surge in new COVID-19 cases; surges that, in many instances, forced those universities to reverse their reopening decisions within just a few weeks.
The table below presents cumulative university-affiliated COVID cases, broken down by college (from the New York Times):
COVID-19 on Campus
Last updated January 25th, 2021
In addition to the criticism leveled against university administrators for jeopardizing the health and safety of their students, to what extent have reopenings put the community at large at greater risk?
One way to answer this question is to analyze case counts attributable to university students as a relative proportion of a county’s overall case counts. The New York Times offers data in both forms: college-affiliated cases and county cases (cumulative). In combination, the data tells a story about which colleges are struggling the most with COVID-19, which college towns saw a COVID spike after university reopenings, and which cities have problems much larger than students throwing fraternity parties.
Below, you can explore your county’s case count relative to its university-affiliated case counts.
COVID-19 on Campus
University cases as a proportion of their overall county
Last updated January 25th, 2021
In two counties, Otsego County (New York) and Pickens County (South Carolina), university-affiliated COVID-19 case counts actually outpace officially recorded COVID-19 cases in their respective counties. This might signal an issue with the data, or a unique way of treating university students in county-wide case counts. According to one of the investigative reporters who recorded this data at the New York Times, county-wide case totals might not include out-of-state residents, such as college students:
Coronavirus infections on campuses might go unnoticed if not for reporting by academic institutions themselves because they do not always show up in official state or countywide tallies, which generally exclude people who have permanent addresses elsewhere, as students often do.
— Danielle Ivory (@danielle_ivory) October 9, 2020
In other counties, we see a more intuitive picture, where college cases constitute a proportion of overall county cases. Even if the same issue is present in these counties, you can understand generally where university COVID case counts are high relative to their county-wide totals, and where they are not.
University-affiliated COVID cases across states
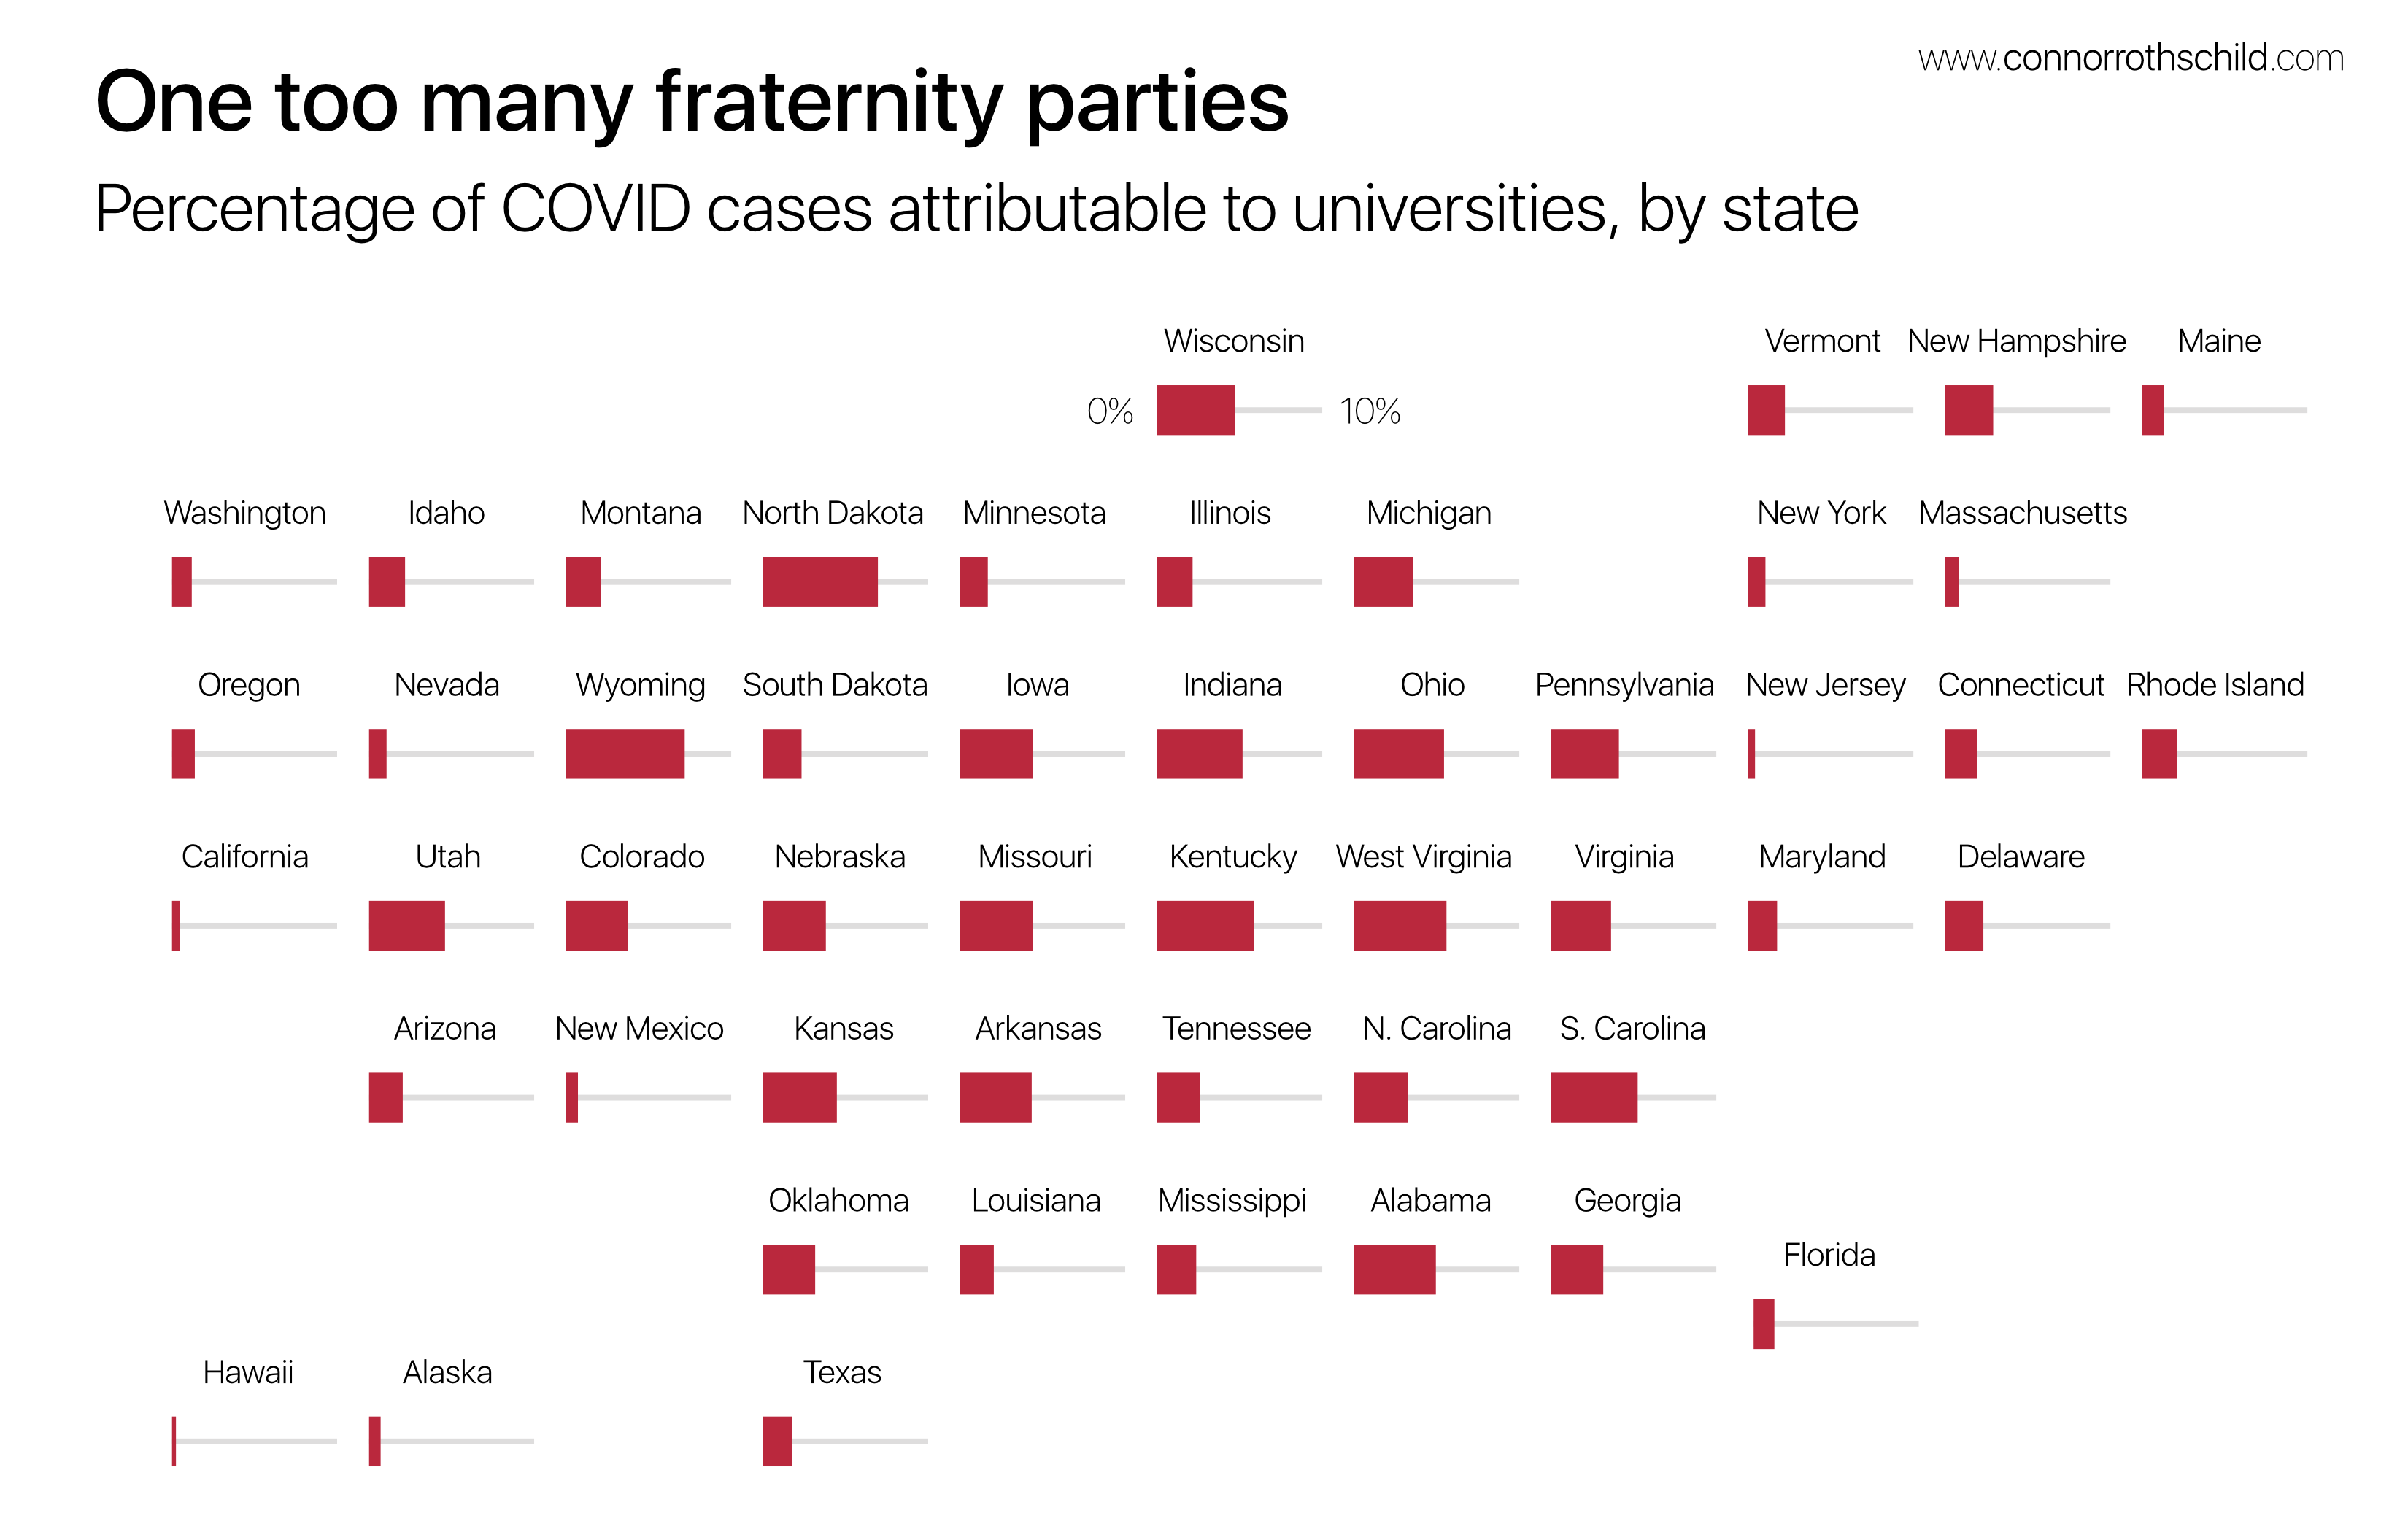
The data also tells a story about COVID case counts on a state-by-state basis, and where college-affiliated cases make up a disproportionate share of cases in the state overall.
Geographically, the data looks like this (note the x-axis runs from 0 to 10%):
In the table below, you can search for your state and drill down on which counties within your state make up the greatest share of COVID-19 cases.
COVID-19 on Campus
University cases as a proportion of their overall state
Last updated January 25th, 2021
Thanks for reading. You can find the code that creates the tables and graphics for this post on GitHub. As always, feel free to message me on Twitter with any questions, comments, or just to say hi 🙂
Connor Rothschild
Undergraduate at Rice University
I’m a senior at Rice University interested in public policy, data science and their intersection. I’m most passionate about translating complex data into informative and entertaining visualizations.