Mapping Houston Homicides
An exploration of homicides in Houston.
Tools used
Mapbox, R
Published
February 2020
Audience
Rice Datathon
What it is
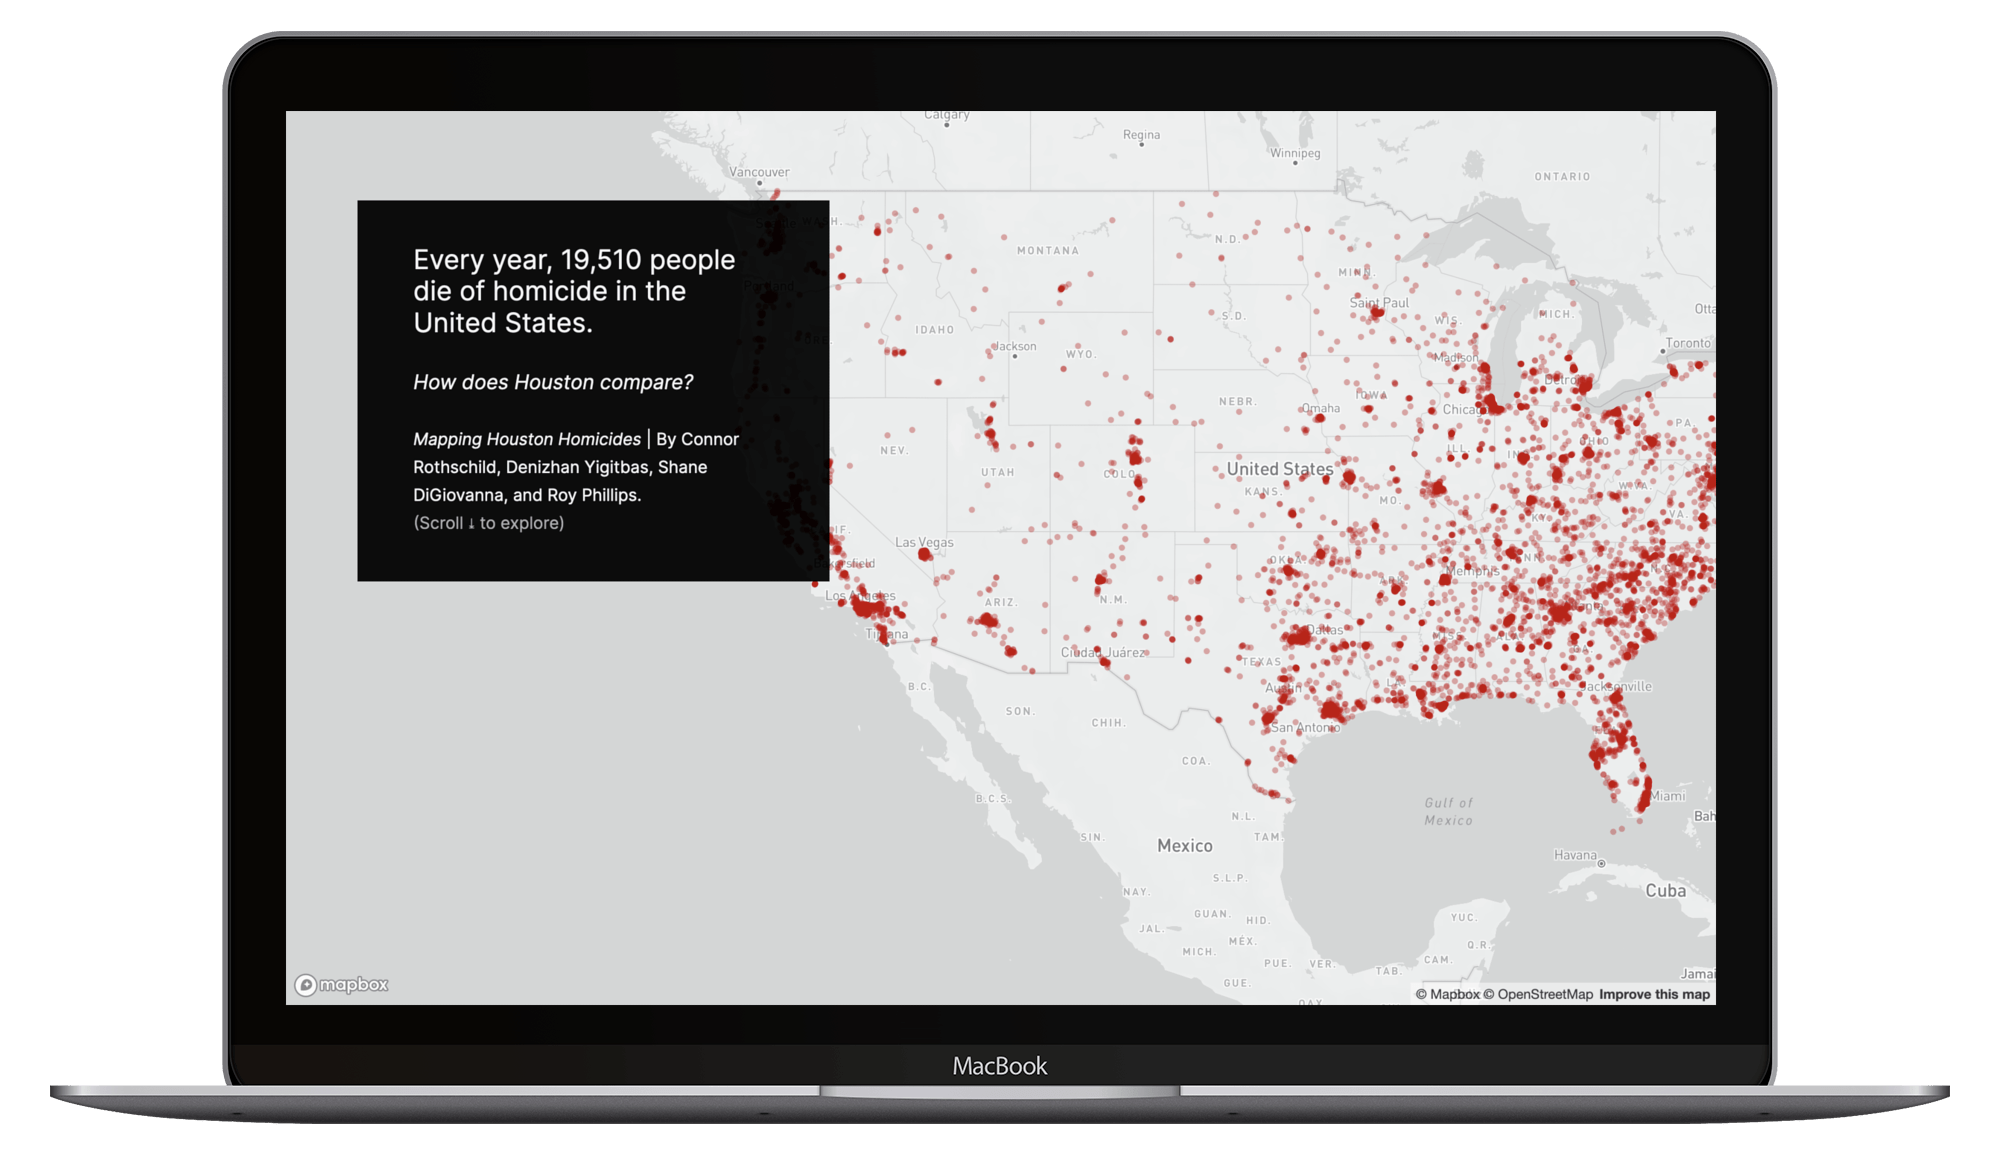
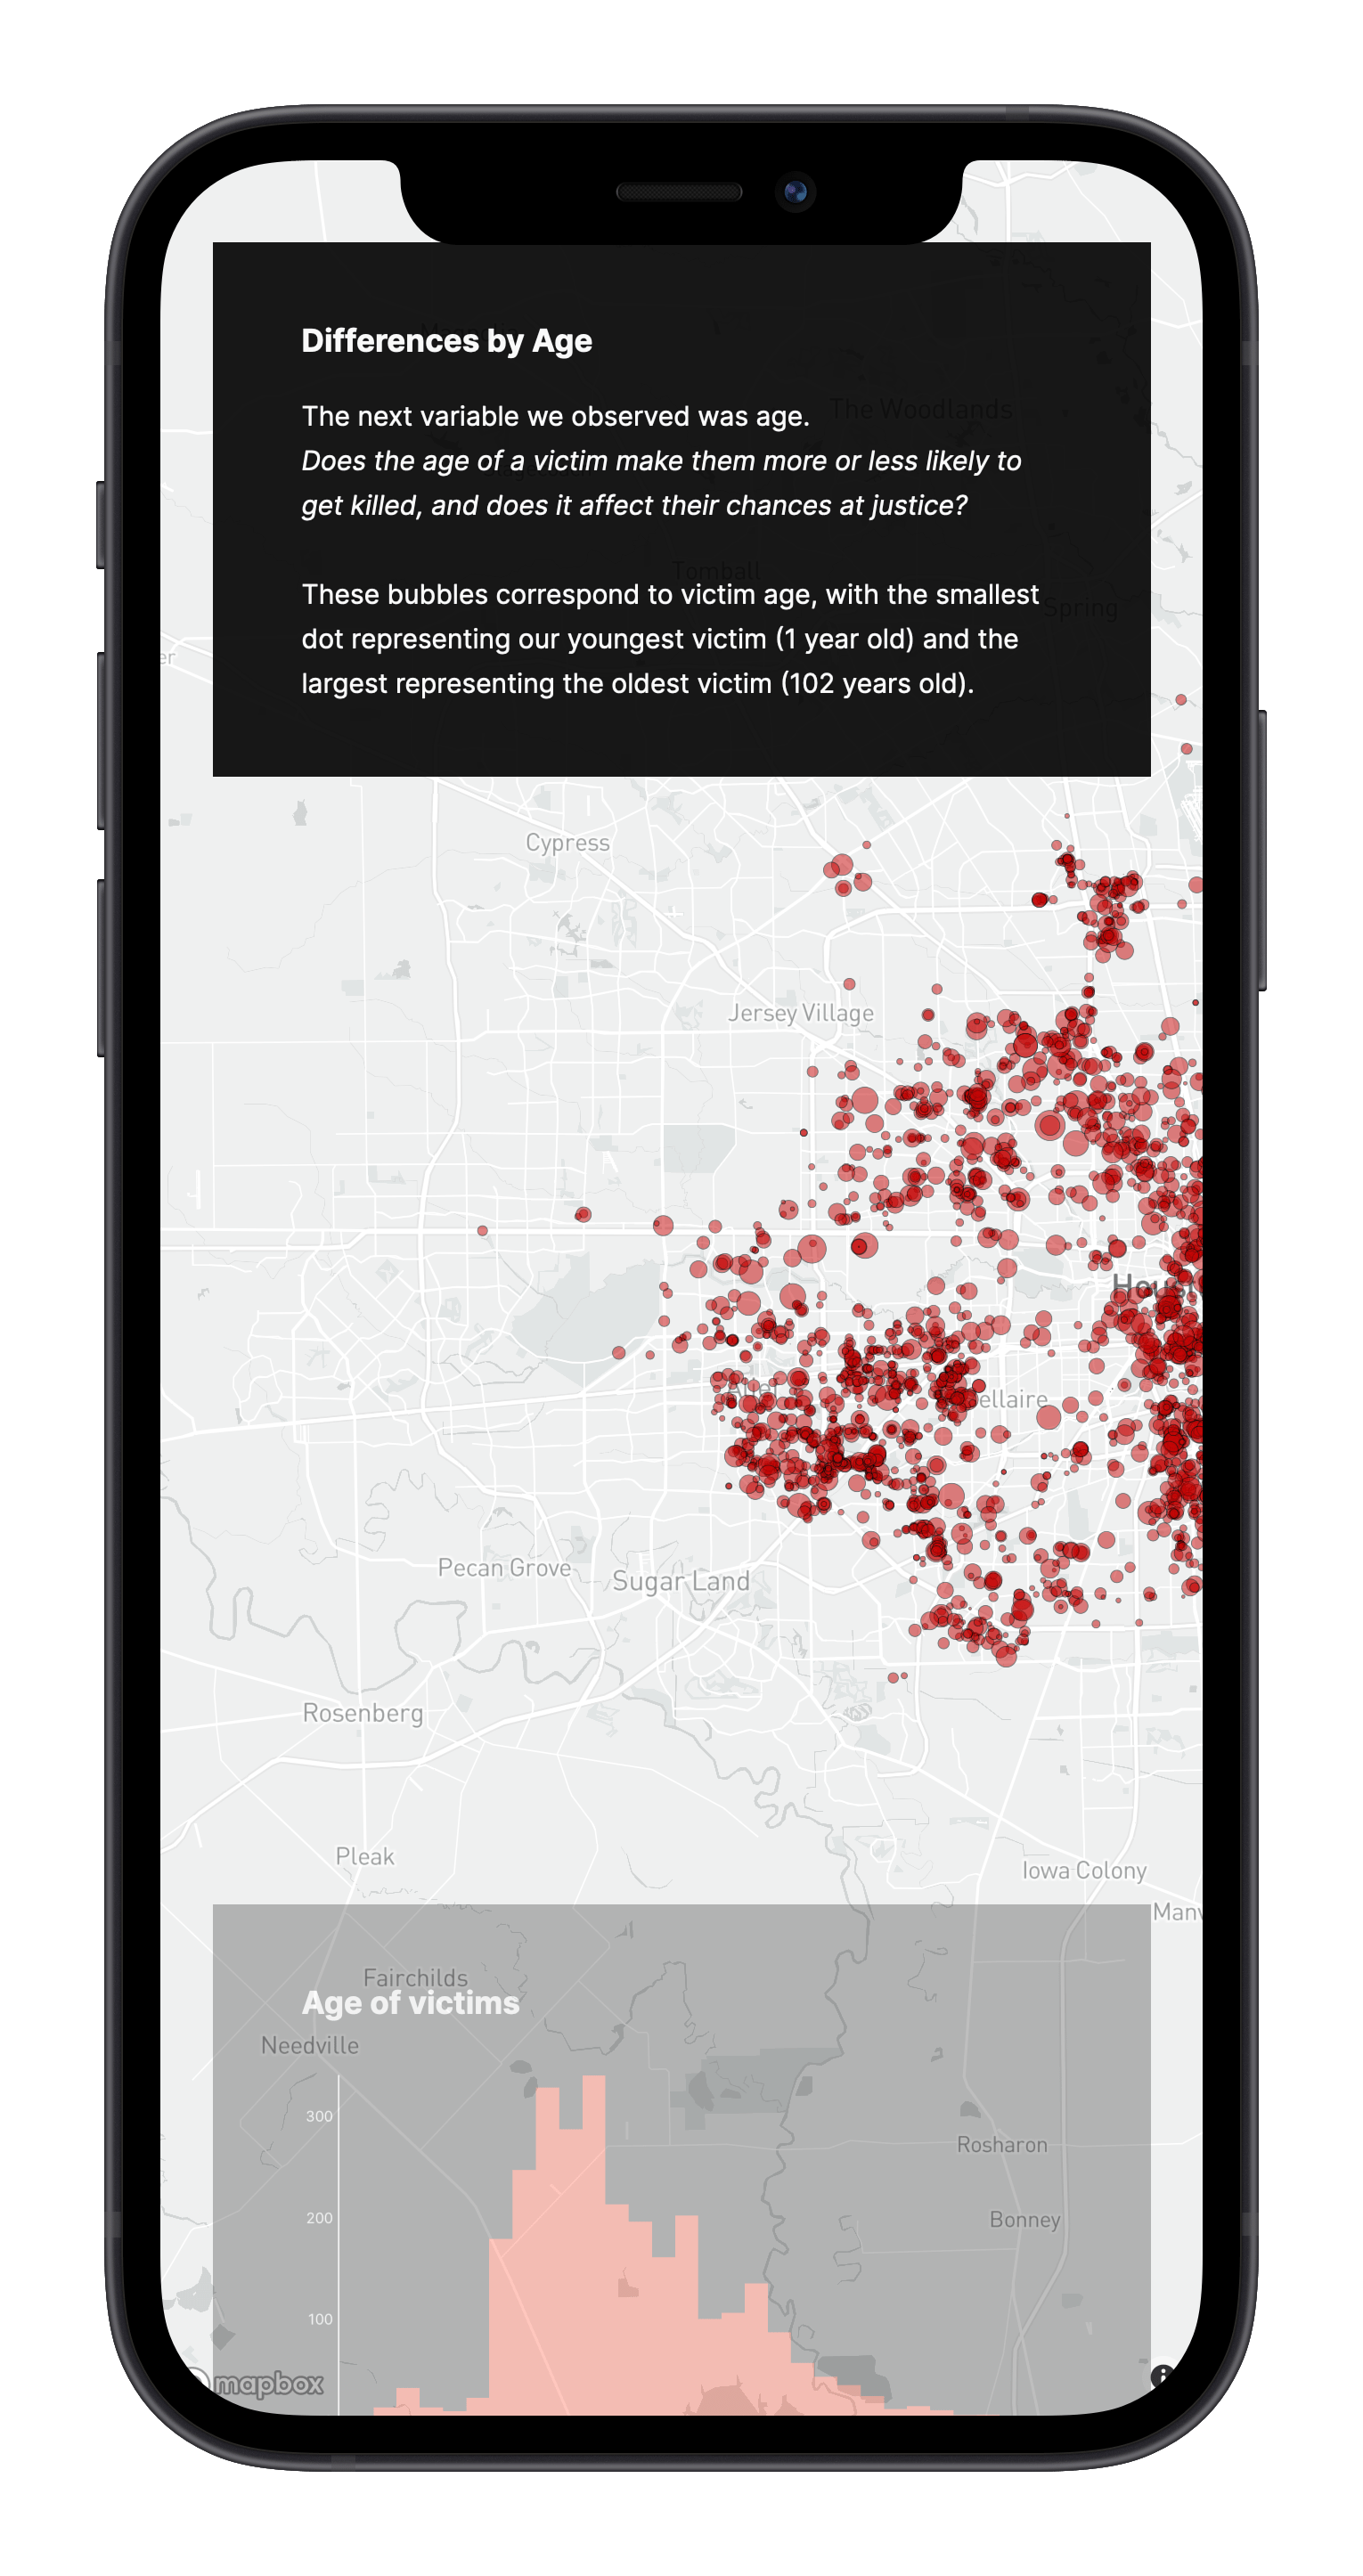
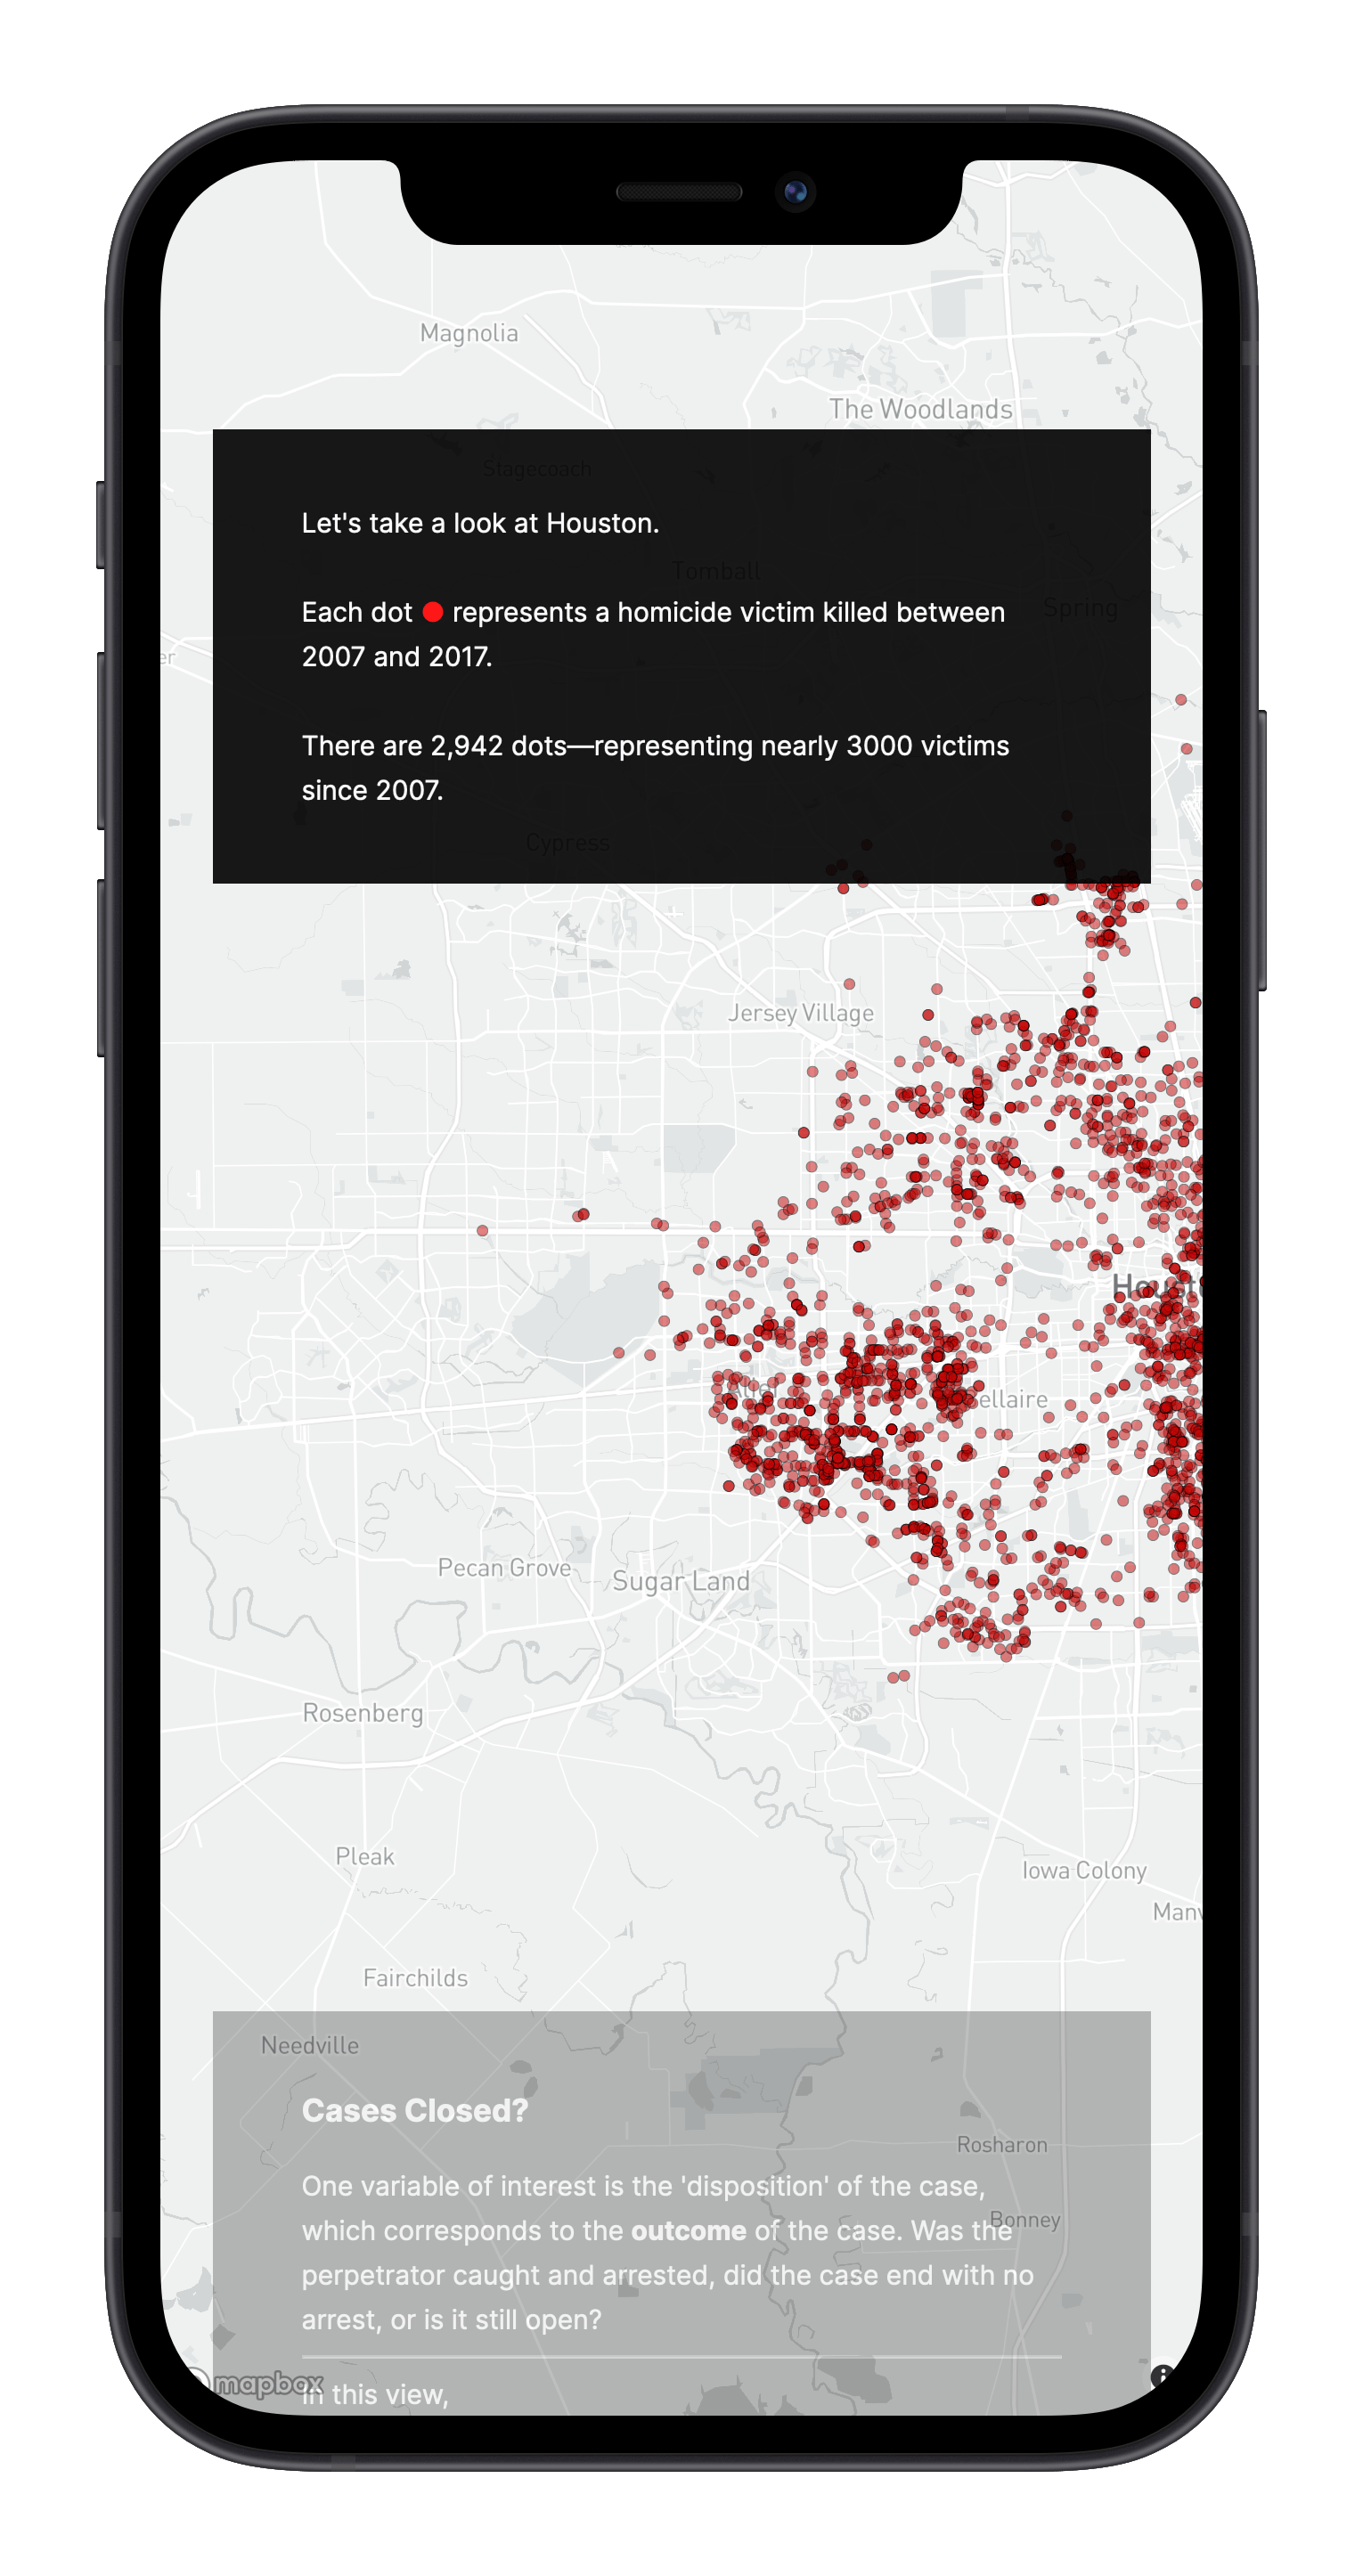
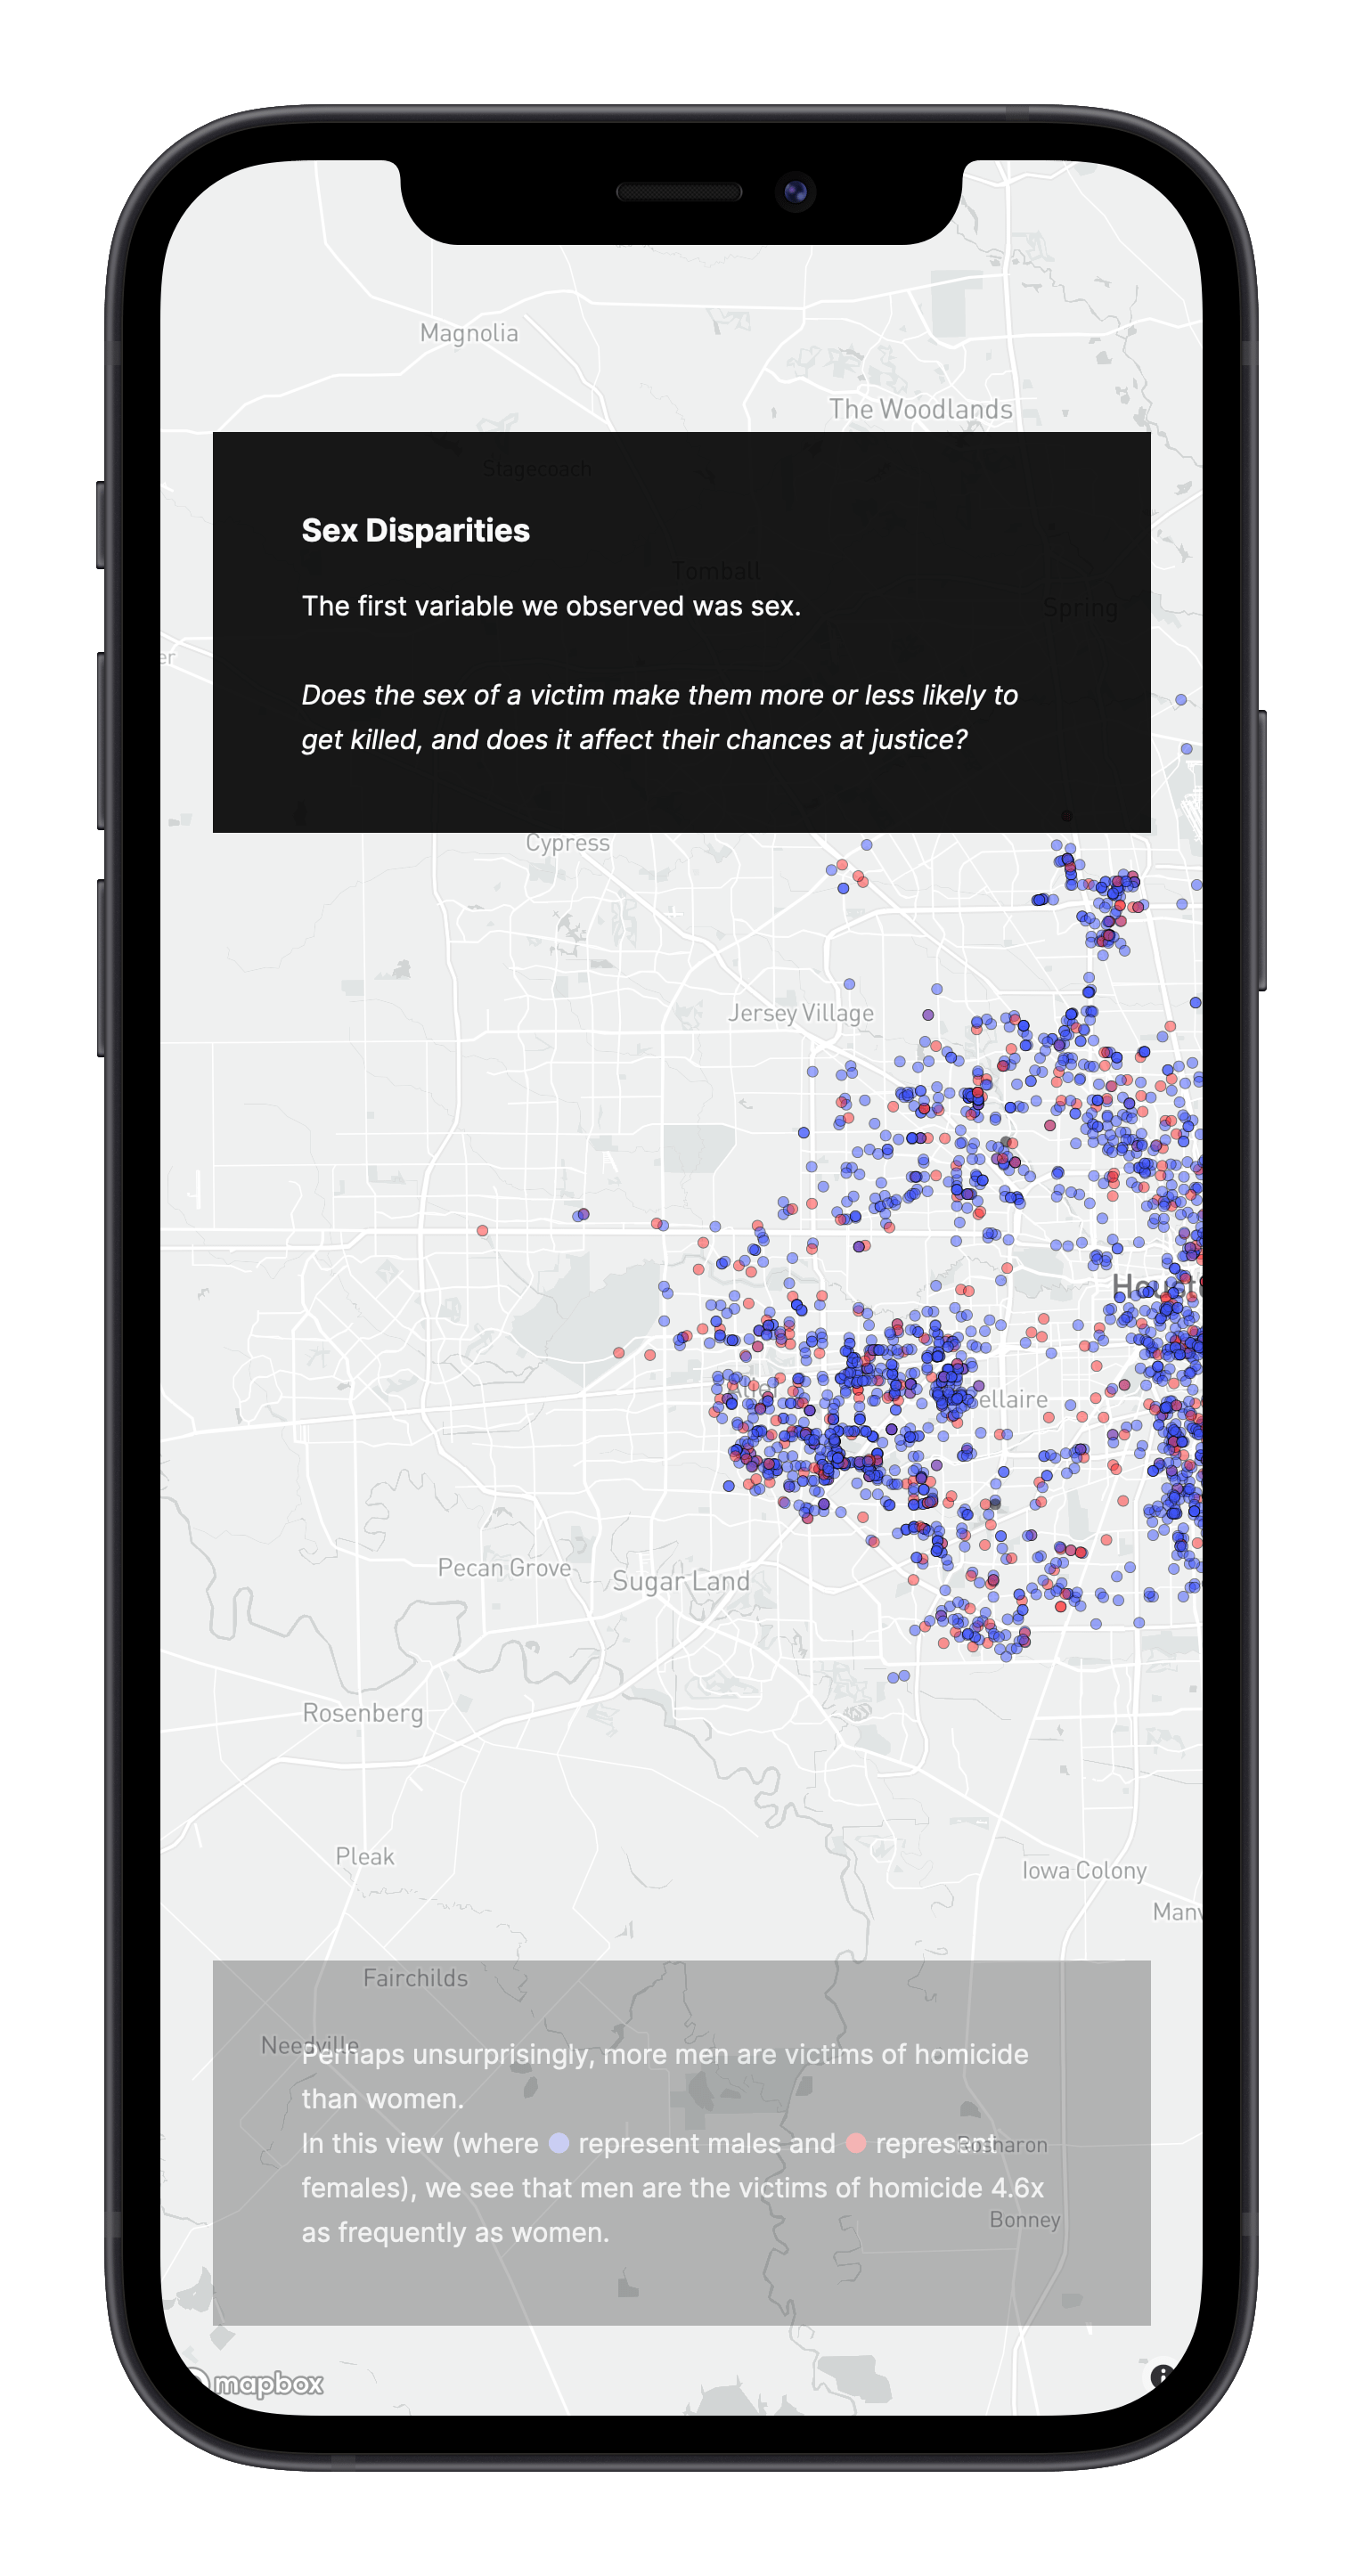
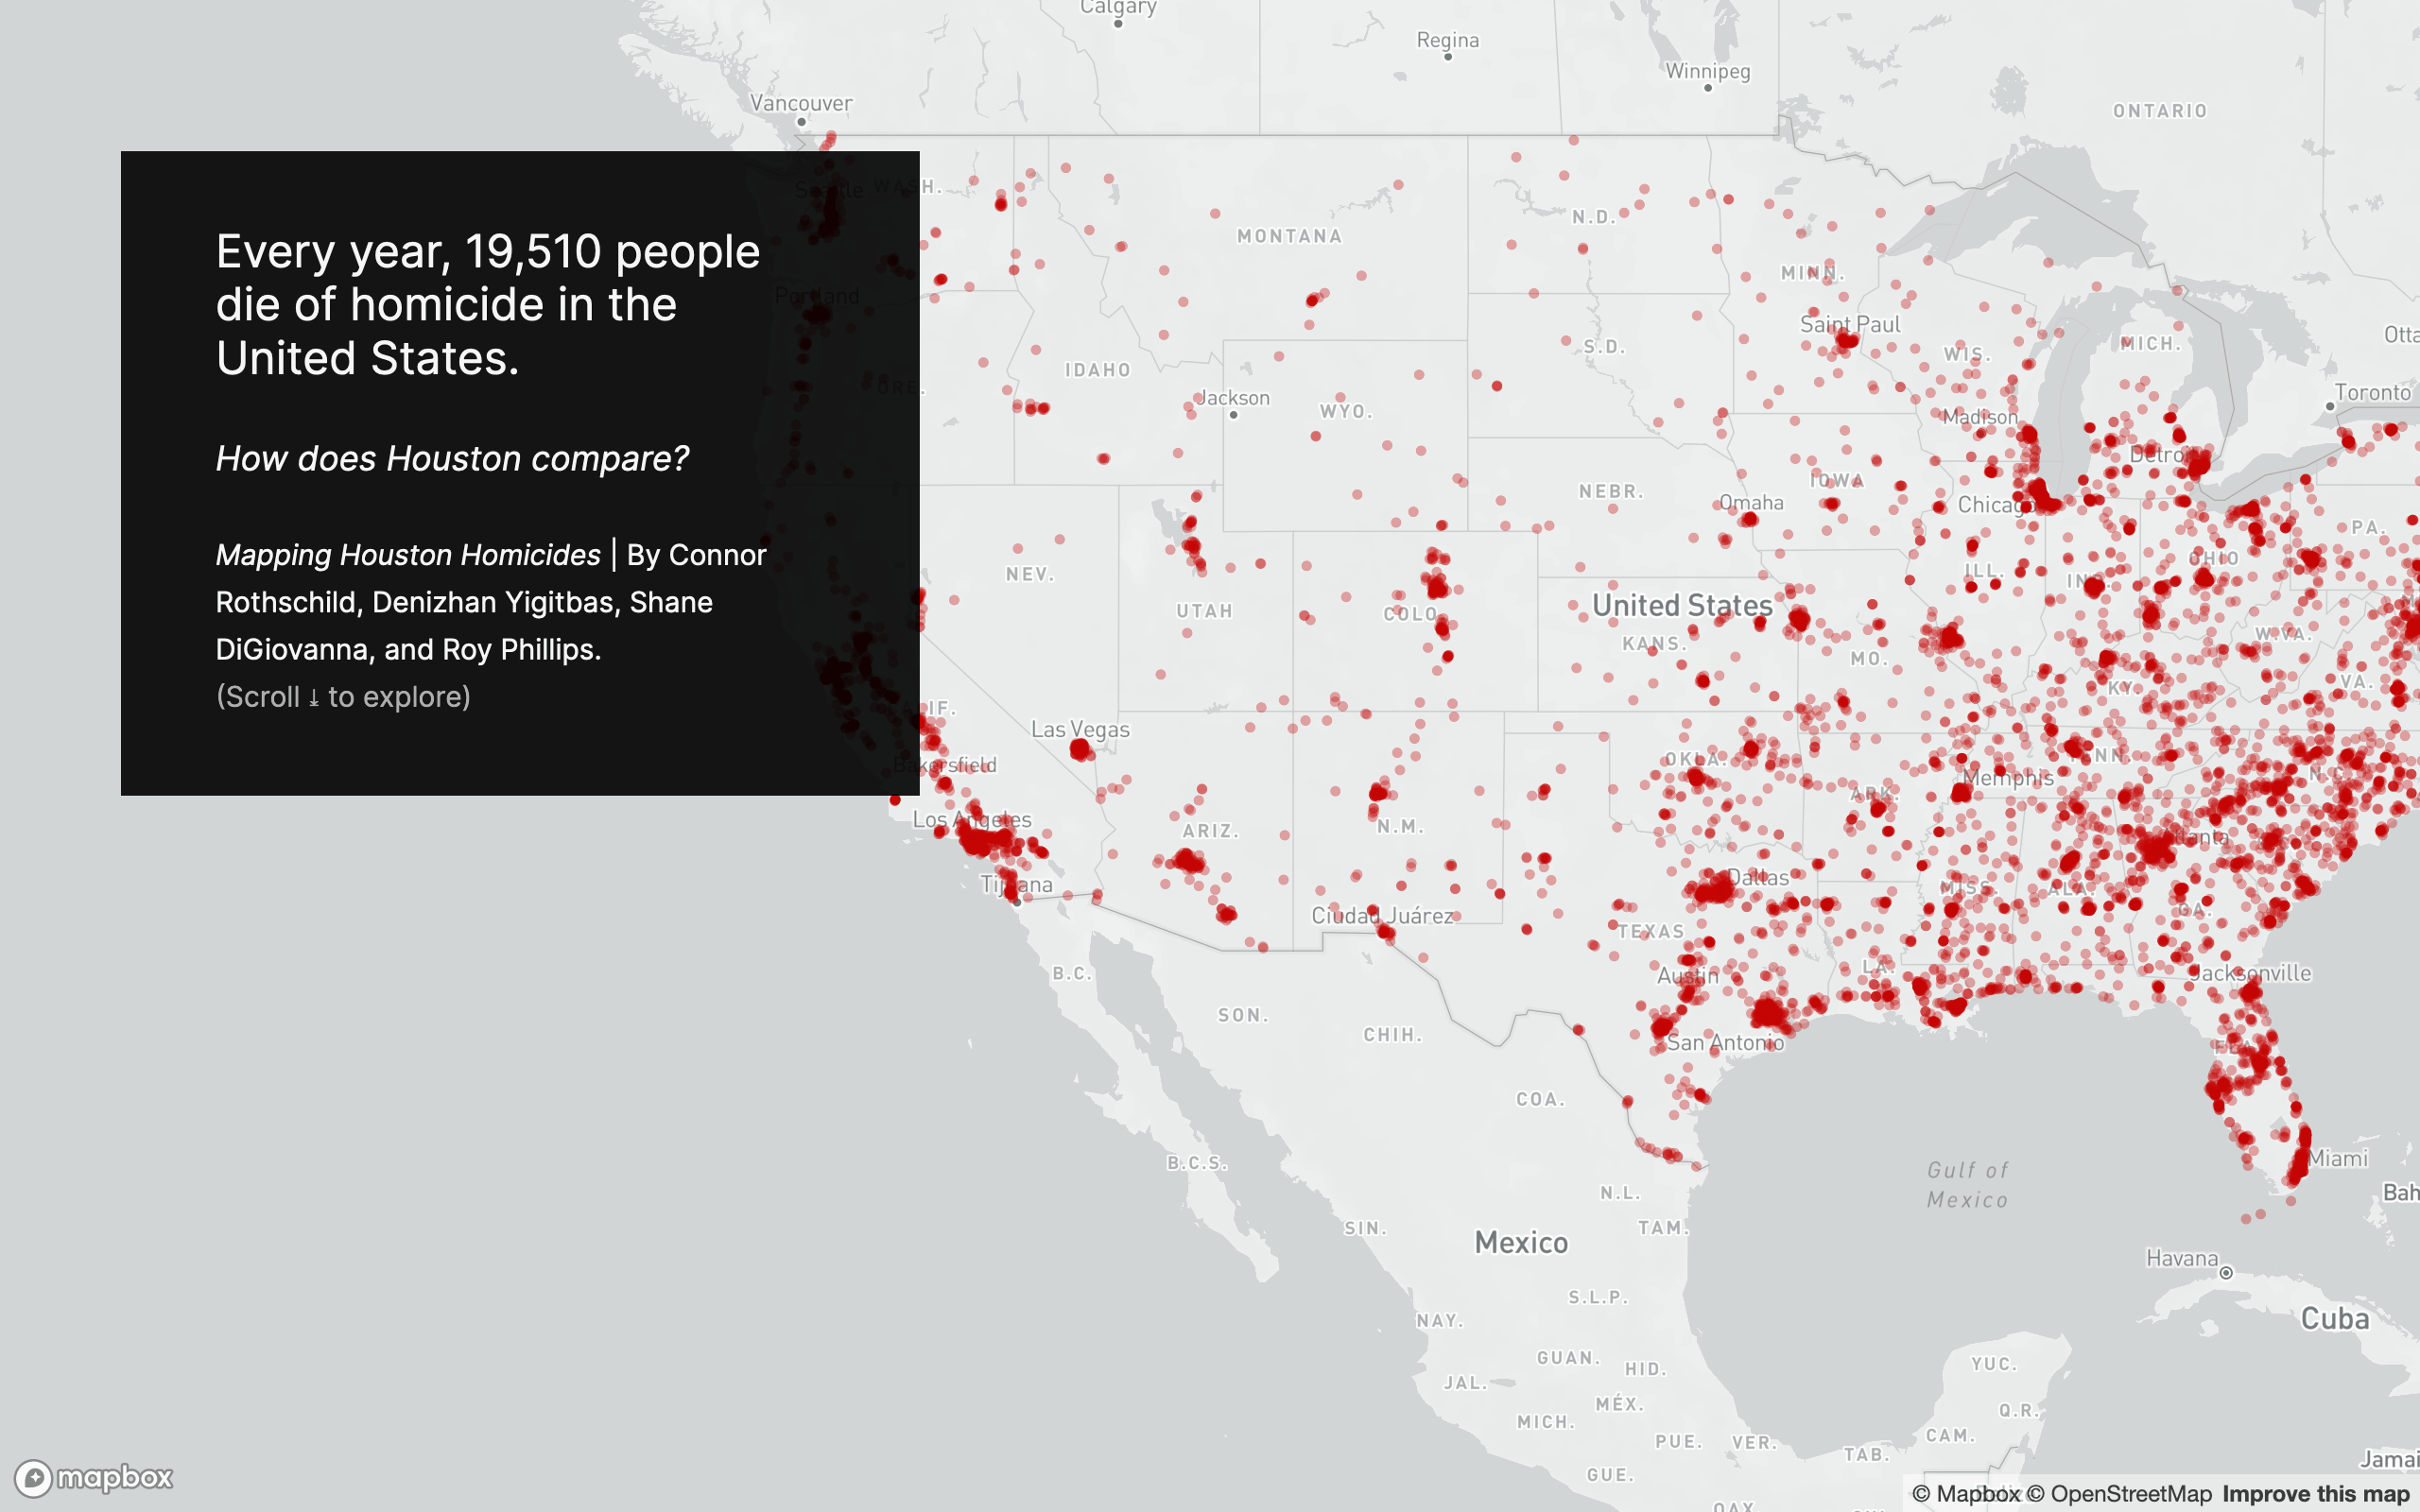
Mapping Houston Homicides is a visual storytelling piece focused on homicides in Houston. It was recognized as the winner of the Houston/Trends track at the 2020 Rice Datathon.
Tools used
This project was an example of a low-code but high-impact story. Rather than reinventing the wheel and implementing my own scrollytelling capabilities, my team used two tools from Mapbox: their interactive storytelling template and Mapbox Studio. In combination, we were able to write very little code but provide a highly tailored, powerful user experience for the reader.
We used Mapbox Studio to create each of the bubbles that is present on the map. As a corollary, we used Studio to define the size, fill, and location of each bubble. we created many different layers that toggled visibility on scroll.
To trigger scroll events, We used the Mapbox storytelling template. This was a simple JSON where, for each 'view', I defined three elements: the text, the layer, and the location.
Project images