Quarantunes
Explore your listening history during COVID-19.
Tools used
D3.js, Vue.js, Bulma, R, Spotify API
Published
October 2020
Audience
The world (2000 users)
What it is
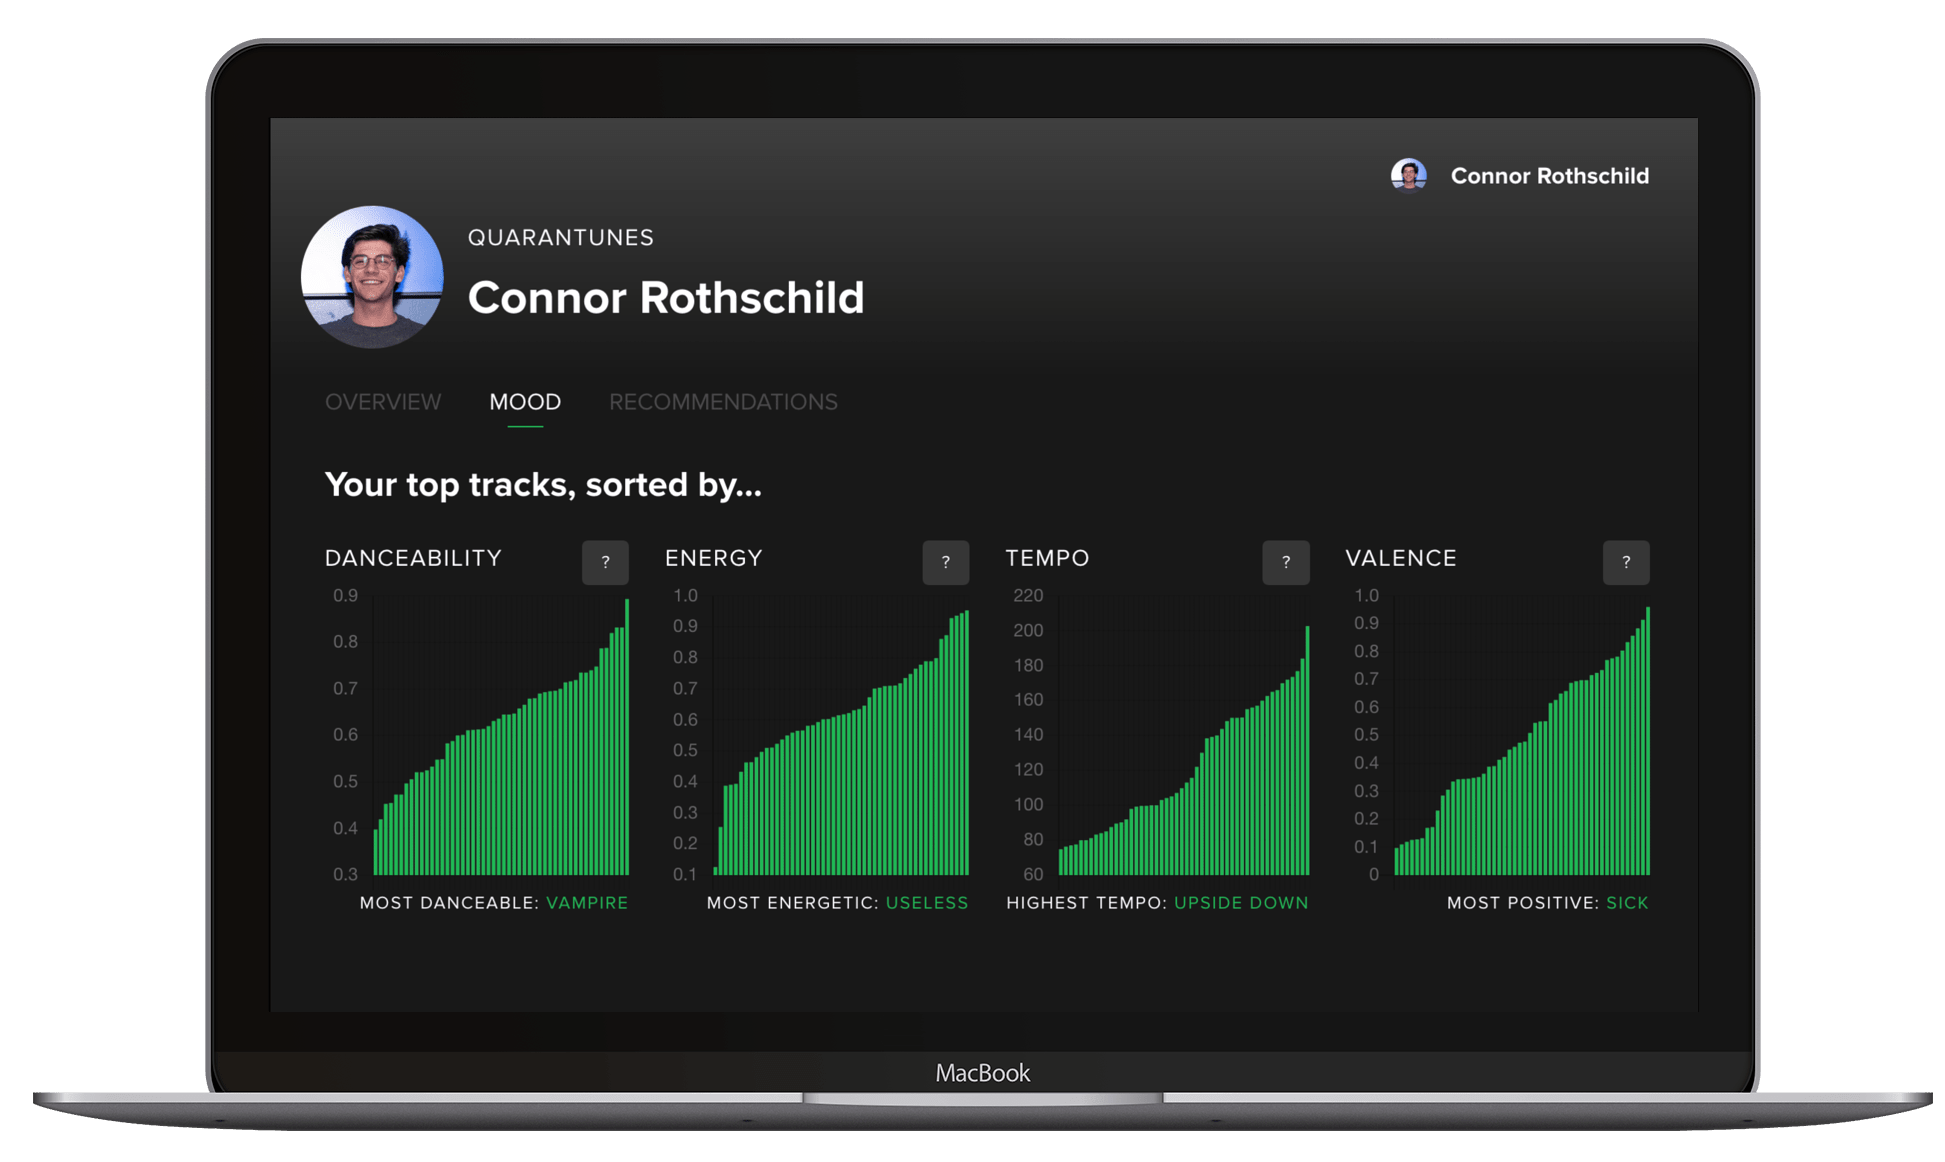
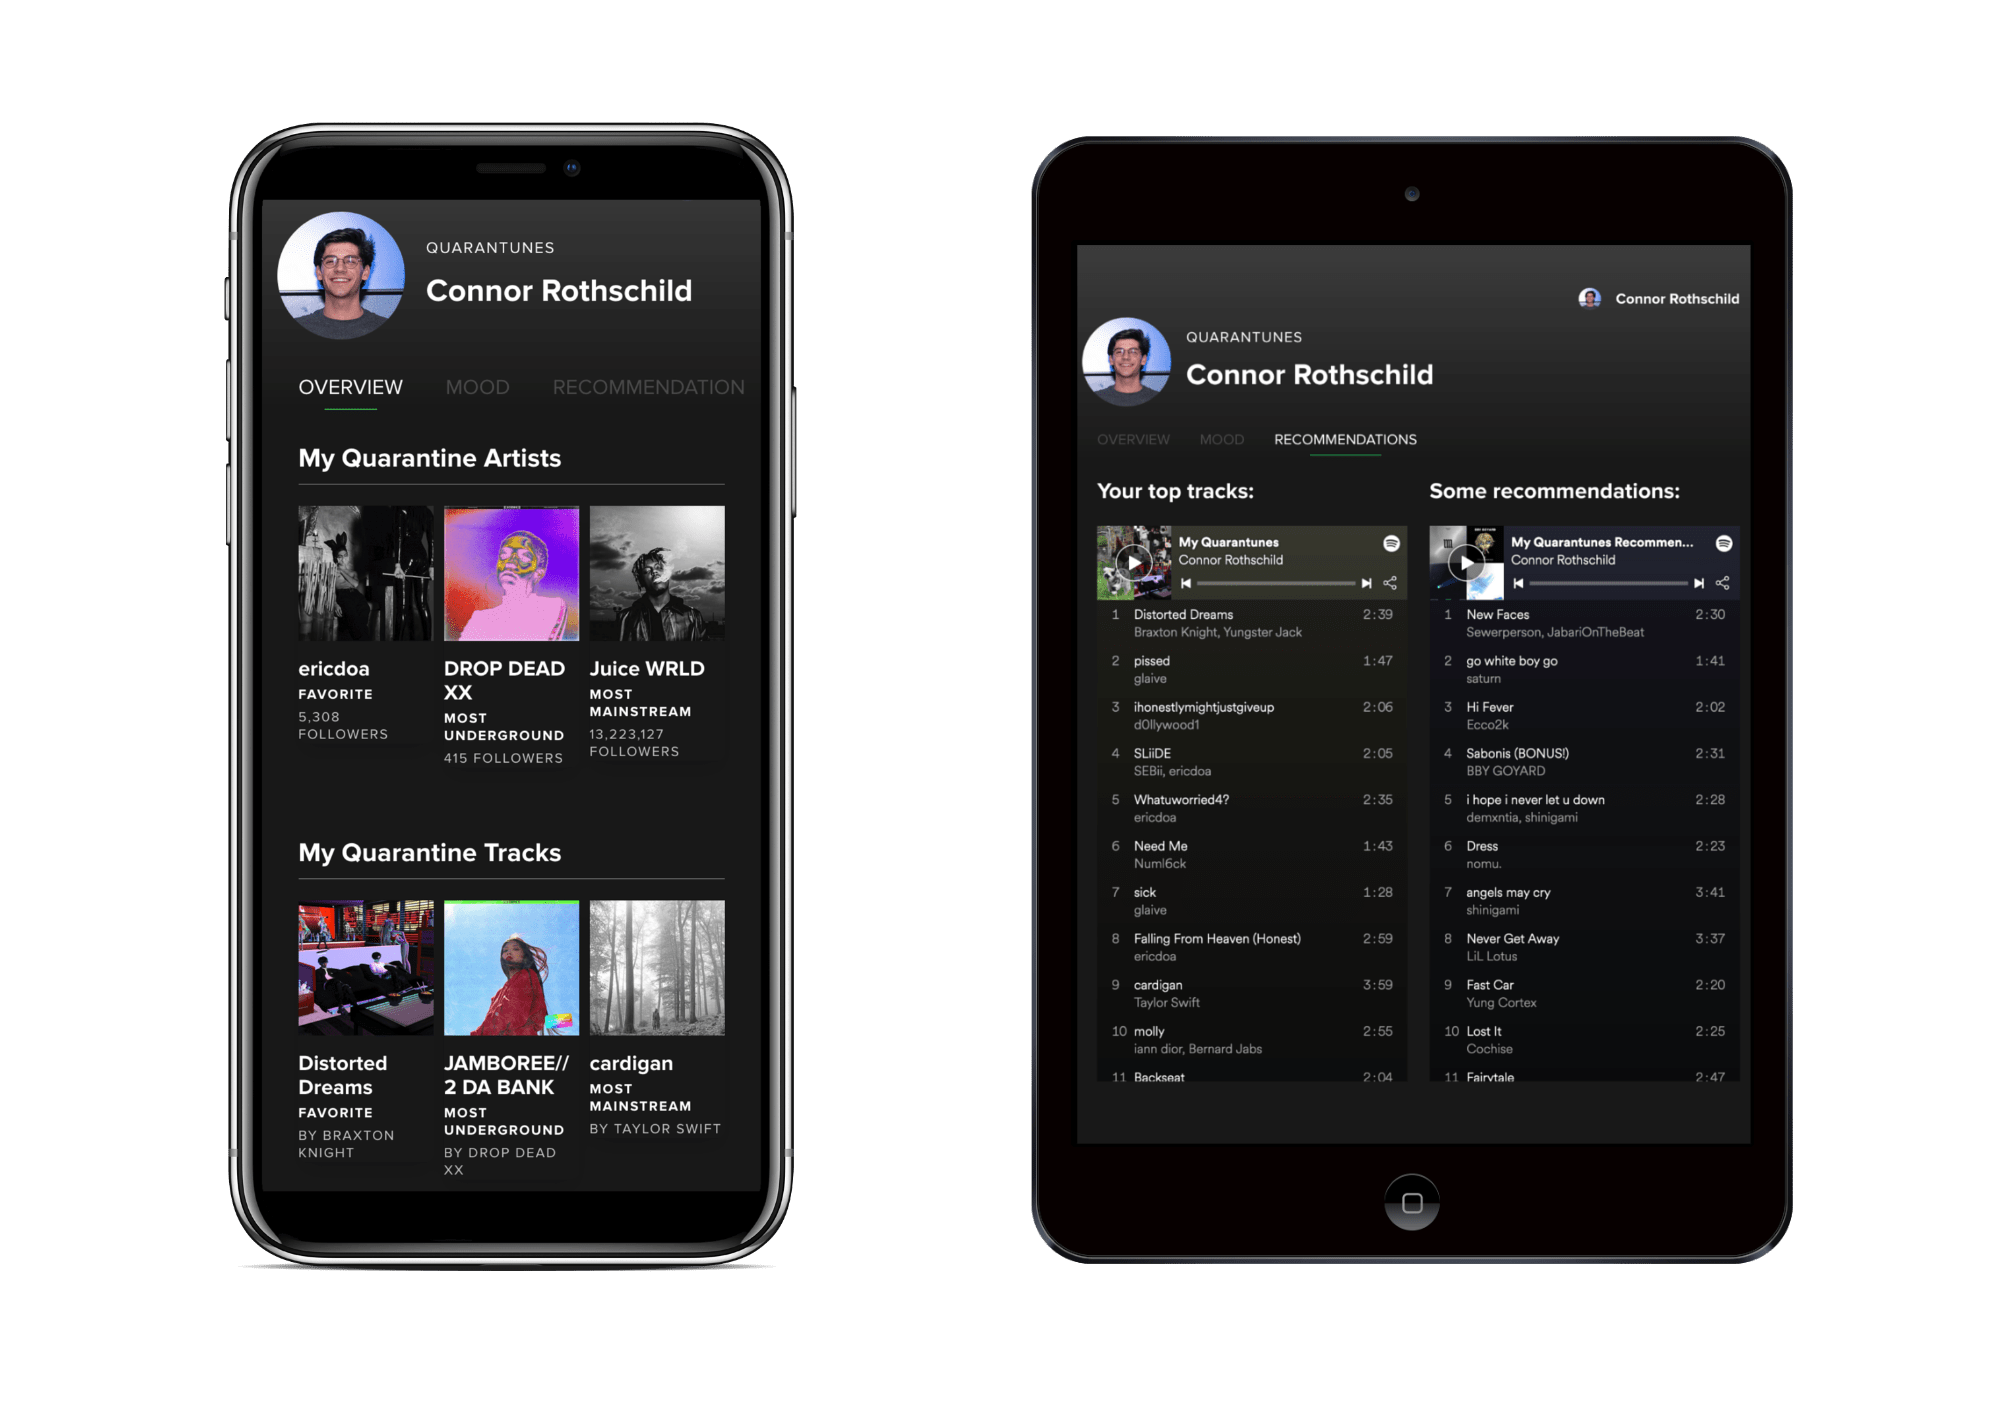
Quarantunes is an application for Spotify users to explore their listening history during the COVID-19 pandemic. It has been used by over 4,000 visitors. There are three tabs within the application. The first showcases 'top artists' and 'top tracks' throughout the pandemic. The second shows some statistics about tracks according to Spotify's audio features (e.g. which of your top songs is most danceable?). The last tab creates two playlists for the user: one with their top tracks and another with recommendations for future listening.
Tools used
I used Vue to design the majority of this application. Charts were built using Chart.js. This was my first serious project working with the Spotify API. Perhaps the greatest lessons I learned throughout this process were related to API calls, asynchronous code, and race conditions. I also learned a bit about cookies; because the application creates a 'recommended' playlist for users, I had to store whether they had visited the site before to prevent creating multiple playlists on app reloads.
I also had some fun developing the more novel contributions of this project, such as a 'recommended' artist and a whole playlist of recommended songs. For recommended artists, I scraped a users' top 50 artists, and for each of those artists, pulled 20 'related' artists according to Spotify. Then, I appended all 1000 (50 x 20) of those artists into one array, and presented the one that appeared most frequently to the user. As for the playlist, I took the users' top 5 tracks and gathered 4 'seed' recommendations based on those tracks. Voila! A playlist of 20 recommendations.
Project images

